The initial self-assessment showed none of the parameters of vocal well-being had significant differences between the three treatment groups (see Table 1). This indicated that the three treatment groups had homogenous samples.
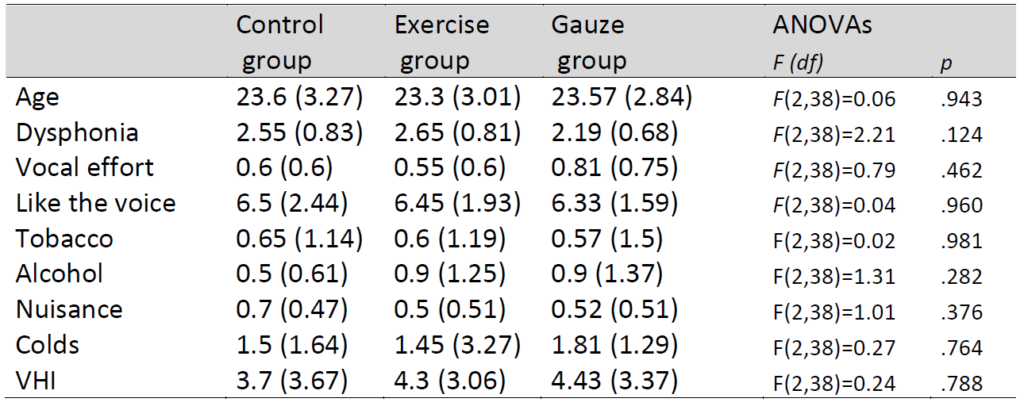
Note: Values reported are means and standard deviations in parenthesis of age (in years), subjective degree of dysphonia (0-10 scale), degree of vocal effort (0-4 scale), tobacco per week (0-4 scale), alcohol per week (0-4 scale), acid reflux (0-4 scale), propensity of colds per year (0-4 scale), and VHI (in a scale from 0 to 40). The last column shows the results from one-way ANOVAs comparing the three treatment groups on the different assessments.
Mean and standard deviations of the laryngostroboscopic, perceptual and acoustic parameters before and after the proposed treatment tasks in the three groups (Control, Exercise and Gauze group) are shown in table 2.
The Kappa test analysis showed that there was excellent agreement between the three external judges and the phoniatrician’s ratings (Glottic Closure: pre-test 0.80, CI=0.68–0.83 and post-test 0.86, CI=0.75–0.90; Amplitude of the mucosa wave: pre-test 0.81, CI=0.69–0.84, and post-test 0.80, CI=0.68–0.83; G: pre-test 0.89, CI=0.75–0.91 and post-test 0.92, CI=0.81–0.95; R: pre-test 0.83, CI=0.65–0.83, and post-test 0.85, CI=0.68–0.85; B: pre-test 0.84, CI=0.67–0.84, and post-test 0.85, CI=0.69–0.87; A: pre-test 0.88, CI=0.73–0.90, and post-test 0.92, CI=0.81–0.95; S: pre-test 0.88, CI=0.73–0.90, and posttest 0.88, CI=0.75–0.91). Both the phoniatrician and the external judges had similar work experience so this may also influence when evaluating similarity. Then, those results showed that the phoniatrician ratings were as accurate as the three external judges. Therefore, the analysis was carried out with the average ratings of the phoniatrician and the three external judges.
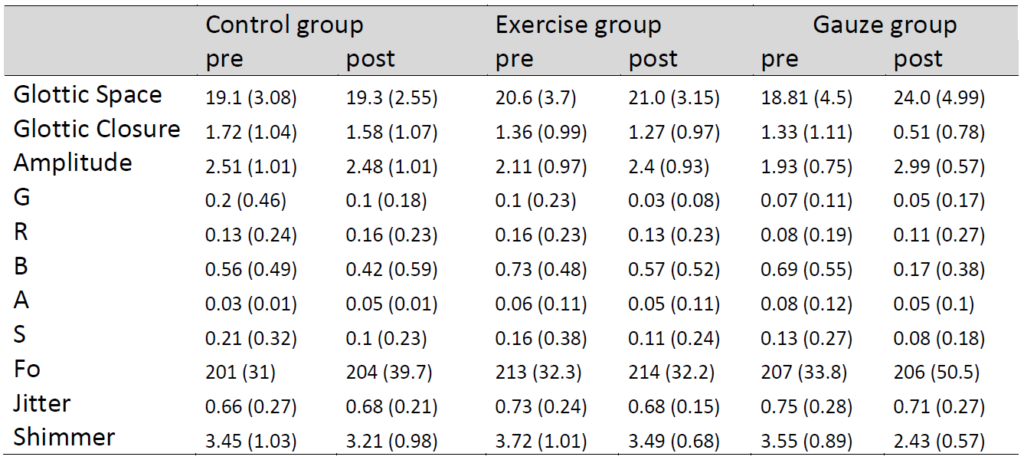
Note. Values reported correspond to the means and standard deviations (in parenthesis) of Glottis (% of glottic space), Glottal Closure (0-4 scale), amplitude (0-4 scale), GIRBAS (0-4 scale), Fo (Hz), Jitter (%) and Shimmer (%).
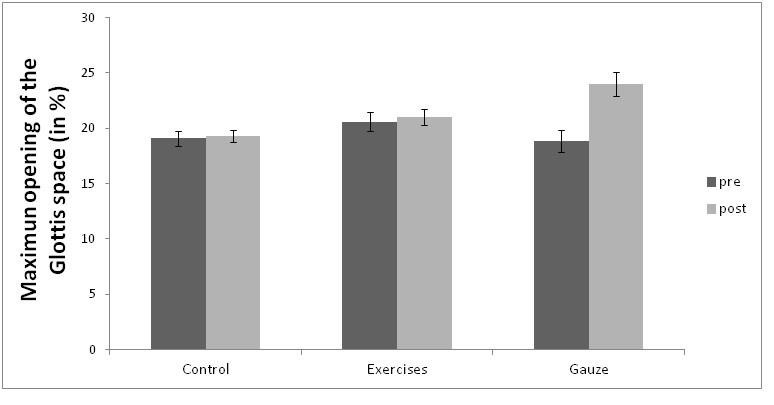
Results regarding Maximum Opening of the Glottic Space showed a significant effect of Test Moment (F(1,58)=34.1, p<.001, η2p=.05) showing more Glottic Space after all treatments. Although there was no significant effect of Treatment Groups (F(2,58)=2.03, p=.141, η2p=.052), the interaction between the two variables was significant (F(2,58)=26.1, p<.001, η2p=.075). To follow up this interaction, Pre-Test and Post-Test conditions were analyzed separately using one-way ANOVAs. The Pre-Test condition showed no significant effect (F(2,38)=1.27, p=.293, η2p=.001), suggesting that the three groups had no significantly different maximum opening of the Glottic Space before each treatment. However, the post-test showed a significant effect (F(2,38)=37.8, p=.001, η2p=.042) suggesting that groups varied significantly in the Post-Test condition. An unpaired t-test comparing each group in the Post-Test was carried out to observe which group differed significantly from the others. Results showed that the Gauze group had significant differences compared with the Control group and the Exercise groups (t(19)=3.66, p=.002, Cohen’s d= 0.819 and t(19)=2.26, p=.036, Cohen’s d= 0.505, respectively). The exercises and Control groups showed no differences between them (t(19)=1.70, p=.106, Cohen’s d= 0.379). The described results are shown in Figure 1.
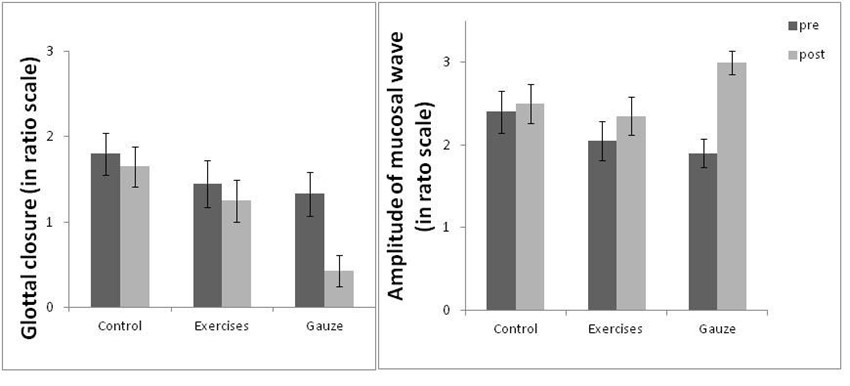
Glottic Closure showed a significant effect of Test Moment (F(1,58)=14.89, p<.001, η2p=.033), showing that all groups had better Glottic closure in the Post-Test condition, and of Treatment Groups (F(2,58)=3.24, p=.046, η2p=.082). Also, there was a significant interaction between the two variables (F(2,58)=5.02, p=.010, η2p=.022). To follow up this interaction, one-way ANOVA for Pre-Test and Post-Test conditions were carried out. The Pre-Test condition did not show a significant effect (F(2,38)=0.86, p=.429, η2p=.004), suggesting that the three groups had similar Glottic Closure before the treatment. However, in the Post-Test condition a significant effect was found (effect F(2,38)=7.20, p=.002, η2p=.026) suggesting that in the Gauze group Glottic closure changed after the treatment. Then, an unpaired t-test of post Test Moments comparing the three Treatments was carried out showing that Gauze group was significantly different from the Control group (t(19)=4.54, p=.002, Cohen’s d= 0.792) and Exercise group (t(19)=2.36, p=.029, Cohen’s d= 0.582), but the other two groups did not show significant differences (t(19)=1.34, p=.197, Cohen’s d= 0.299) suggesting that after the
Gauze group there was more Glottic closure (see figure 2).