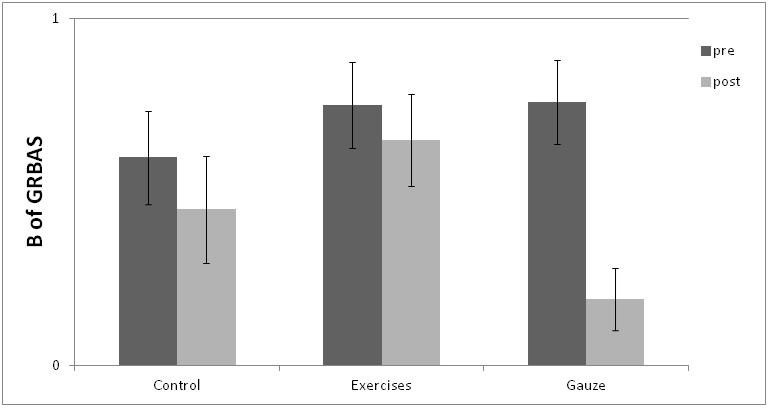
The Amplitude of the mucosal wave showed a significant effect of Test Moment (F(1,58)=30.5, p<.001, η2p=.067) suggesting that the three groups had a greater amplitude in the Post-Test, but with no effect on Treatment Groups (F(2,58)=0.410, p=.665, η2p=.011). The interaction between the two variables was significant (F(2,58)=11.5, p<.001, η2p=.050). To follow up the interaction, as for the other variables, a one-way ANOVA for Pre and Post-Test conditions was carried out. Results showed that in the Pre-Test, mean amplitudes were not significantly different (F(2,38)=1.40, p=.259, η2p=.031), but in the Post-Test condition the difference was significant (F(2,38)=3.67, p=.036, η2p=.098). The unpaired t-test showed that the Gauze group significantly differed from the other groups (Control group: t(19)=2.12, p=.047, Cohen’s d= 0.476 and Exercise group: t(19)=2.35, p=.020, Cohen’s d= 0.567), and no significant differences were found between these two groups (t(19)=0.29, p=.772, Cohen’s d= 0.066), suggesting that the Gauze group showed significantly greater amplitude of mucosal wave after the warmup (see figure 2). The G of GRBAS did not show any significant effect (all p > .12), neither the R (all p > .31), the A (all p > .11) and the S (all p > .13). However, the B showed a significant effect of Test Moment (F(1,58)=15.79, p<.001, 2p=.0565) and interaction between the two variables (F(2,58)=3.20, p=.048, η2p=.026). The Pre-Test one-way ANOVA showed that the three groups were not significantly different (F(2,38)=0.658, p=.524, η2p=.022), but the Post-Test one-way ANOVA was significant (F(2,38)=4.01, p=.027, η2p=.062). The unpaired sample t-test showed that the Gauze group was significantly different from the other two (Control group: t(19)=2.17, p=.043, Cohen’s d= 0.486 and Exercise group: t(19)=3.48, p=.002, Cohen’s d= 0.780) and that the Control and the Exercise groups did not differ significantly (t(19)=0.76, p=.453, Cohen’s d= 0.171), suggesting that only the Gauze group improved breathiness after warm-up (see Figure 3).
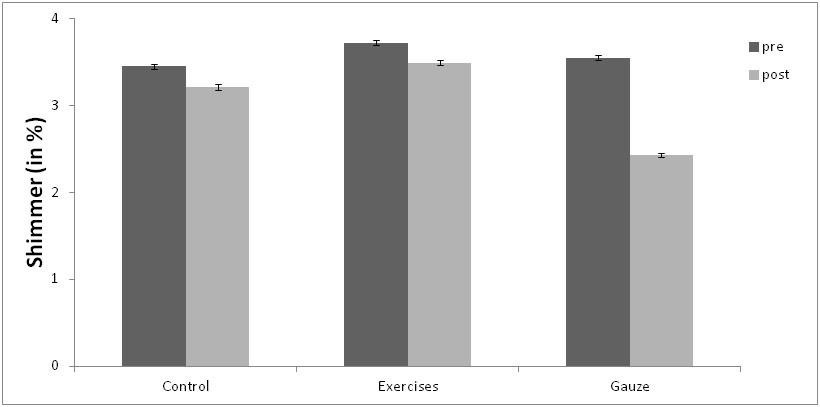
Acoustic analysis showed that the F0 variations were not significant (all p > .63) nor the Jitter variations (all p > .53). However, the Shimmer showed a significant effect of Test Moment (F(1,58)=20.55, p<.001, η2p=.079) and Treatment Groups (F(2,58)=3.69, p=.031, η2p=.073) with a significant interaction between the two variables (F(2,58)=6.48, p=.003, η2p=.050), suggesting that the Gauze group was different from the other two.
The pre-test one-way ANOVA analysis showed that the three groups were not significantly different before the treatment (F(2,38)=0.35, p=.703, η2p=.026), but after the treatment they differed significantly (F(2,38)=15.41, p<.001, η2p=.018). The unpaired t-test showed that the Gauze group differed from the other two groups after the treatment (Control group: t(19)=3.31, p=.004, Cohen’s d= 0.741 and Exercise group: t(19)=5.52, p<.001, Cohen’s d= 1.235), while no significant differences were differences were found between Exercise and Control group (t(19)=0.97, p=.341, Cohen’s d= 0.218), suggesting that after the Gauze treatment task participants had significantly better Shimmer values (see Figure 4).